Dashboard
The dashboard is the main operational overview in SVRunner. It brings together playback health, screen and target state, Quick Play status, systems, extension-driven filters, and selected actions in one place.
What Appears On The Dashboard
The exact content of the dashboard depends on the project configuration, but it commonly includes:
- target and playback panels
- Quick Play status
- system status panels
- extension-driven filter panels
- actions marked for dashboard display
This makes the dashboard the fastest place to answer the question: "Is the system healthy right now, and do I need to act?"
What Operators Should Look For First
When opening the dashboard, check these areas first:
- target and playback status
- player frame rate and output state
- Quick Play enabled or disabled state
- system panels showing degraded or offline integrations
- any action panels intended for operational control
Target And Playback Panels
Target panels are often the most operationally important part of the dashboard.
They can expose:
- screens associated with a target
- now-playing information
- brightness state
- preview shortcuts
- player rows with health and on-screen status
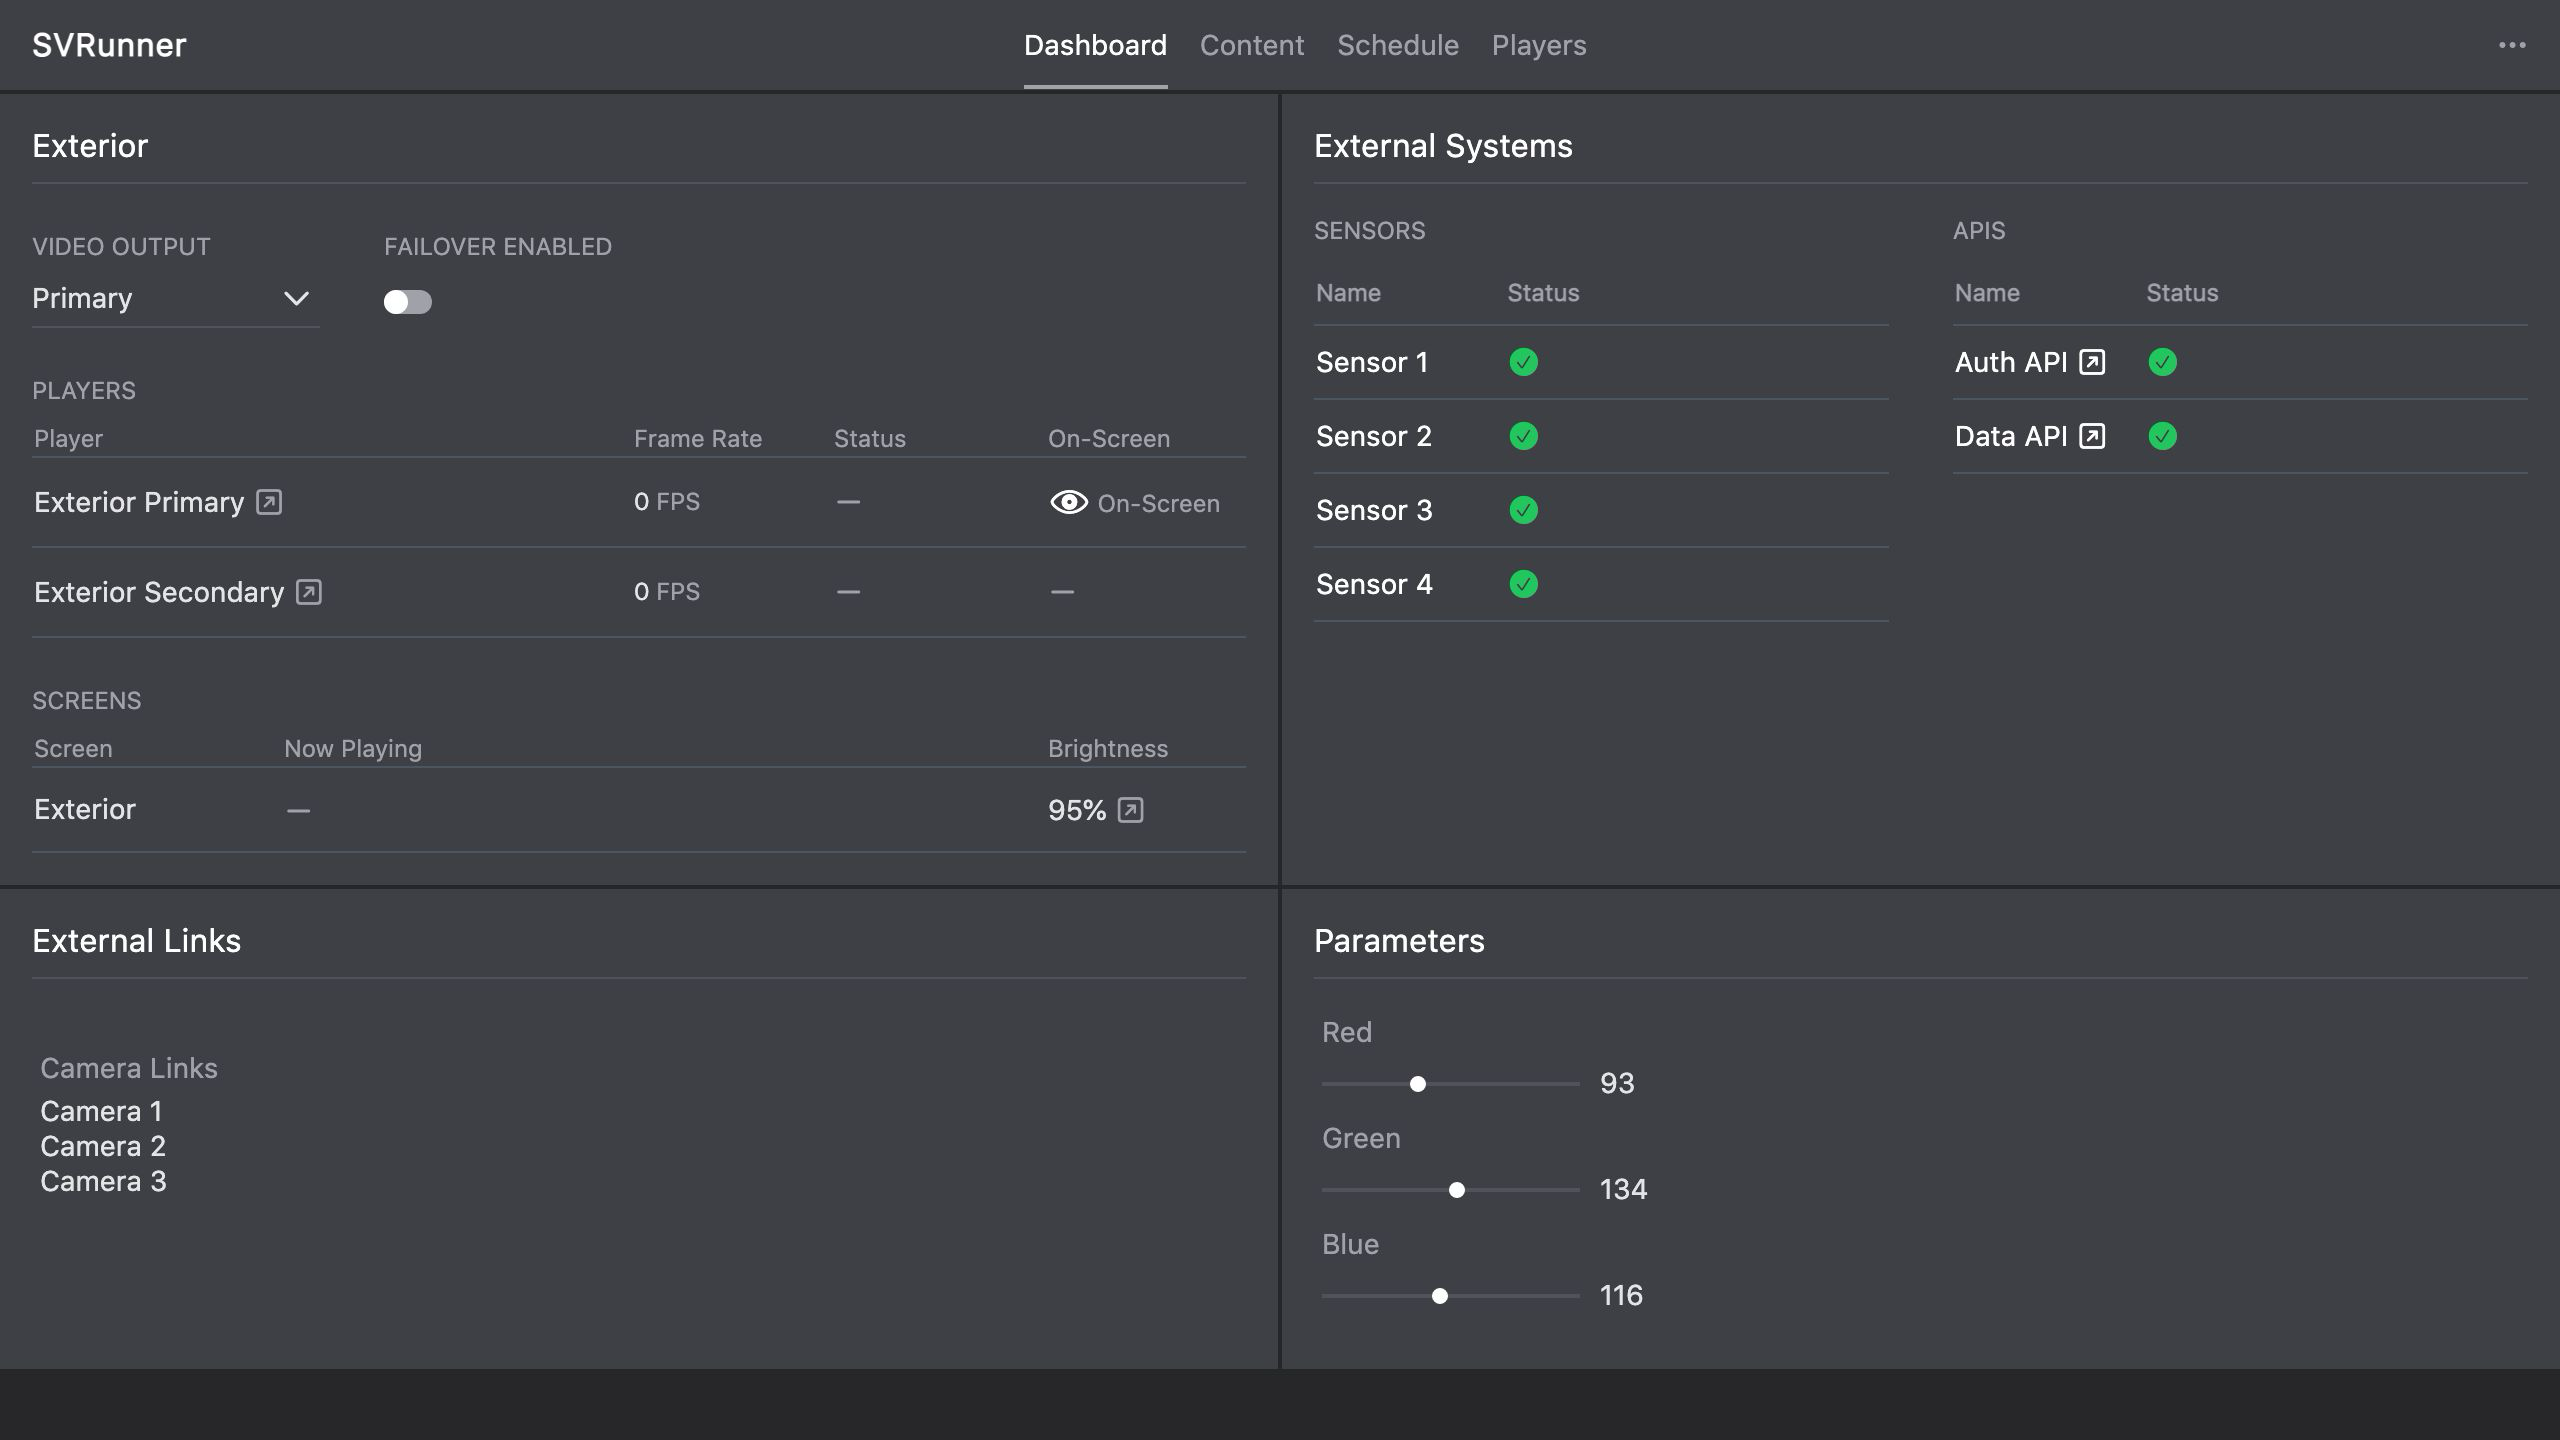 Stub screenshot: full dashboard with at least one target panel, the Quick Play panel, and a system panel visible at the same time. Save final image at
 packages/docs/screenshots/app-dashboard-overview.png.
Use these panels when you need a quick answer about whether content is playing correctly on a specific display path.
Quick Play Panel
The dashboard surfaces Quick Play so operators can immediately see whether an override is active.
This is important because Quick Play changes expected playback behavior across the affected screens.
If Quick Play is active unexpectedly, treat that as a high-priority operational check.
Systems Panel
The systems panel exposes monitored external or supporting systems.
Use it to:
- identify offline or degraded integrations
- decide whether a broader issue may be affecting playback or automation
- escalate to an admin when a dependent system is not healthy
Extension-Driven Panels
Some dashboard content is generated from extensions.
- filters can be configured to appear on the dashboard
- project-specific installations may rely on these panels for highly specific operational workflows
Operators should treat these as deployment-specific controls or views rather than generic core features.
Action Panels
Actions can be explicitly marked for dashboard display.
This is useful when an operator needs direct access to frequently used controls without navigating deeper into the scheduling interface.
Examples include:
- operational automation triggers
- brightness-related controls
- system-level control panels for supported action types
Typical Operator Workflow
- Open the dashboard at the start of a shift.
- Check for unhealthy targets, players, or systems.
- Confirm Quick Play is in the expected state.
- Review any action or filter panels relevant to the day's operation.
- Jump to players, screens, calendar, or preview if a panel indicates a problem.
Common Mistakes
- assuming the dashboard is purely informational and missing actionable alerts
- forgetting that extension-driven panels may be project-specific and operationally important
- overlooking Quick Play when playback looks different than expected
- checking a single player in isolation instead of reading the whole target panel